Best and Worst Times to Visit Puerto Quetzal
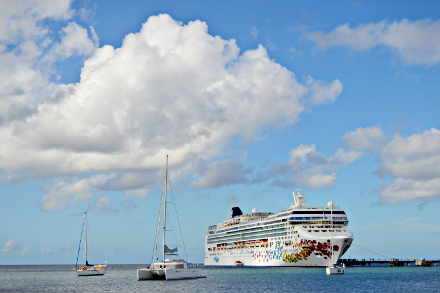 |
| Credit: Wikimedia Creative Commons license |
The best times to visit Puerto Quetzal are March and April when average high temperatures hover around 90 degrees Fahrenheit and rainfall is low.
The worst times to visit Puerto Quetzal, also known as Puerto San Jose, are May through October during the rainy season.
This small cruise port on the Pacific coast of Guatemala is tropical, often hot and rather humid. The terrain is mostly mountains with narrow coastal plains, so the highlands are often cooler.
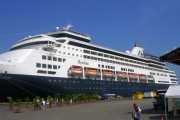
Cruise passengers who disembark at Puerto Quetzal often visit the nearby San Jose as well as other attractions in the region.
Average Monthly Temperatures
The table below from the Guatemala Institute of Meteorology shows the average high temperatures in Celsius by month over a 20-year period. Temperatures stay fairly steady throughout the year with average daytime highs in the low 30s Celsius or more than 90 degrees Fahrenheit.
| JAN | FEB | MAR | APR | MAY | JUN | JUL | AUG | SEP | OCT | NOV | DEC | ANNUAL | |
|---|---|---|---|---|---|---|---|---|---|---|---|---|---|
| 1990 | 33.0 | 33.2 | 33.9 | 34.6 | 33.0 | 33.1 | 33.1 | 33.4 | 32.6 | 32.0 | 32.2 | 32.6 | 33.1 |
| 1991 | 32.4 | 32.9 | 33.7 | 34.6 | 34.4 | 33.7 | 34.1 | 33.9 | 32.8 | 32.2 | 32.9 | 33.1 | 33.4 |
| 1992 | 33.3 | 33.3 | 34.5 | 34.1 | 34.4 | 33.5 | 33.1 | 33.1 | 32.0 | 32.5 | 32.5 | 32.8 | 33.3 |
| 1993 | 32.3 | 32.8 | 34.1 | 34.9 | 34.0 | 32.7 | 33.0 | 33.1 | 32.0 | 32.4 | 32.4 | 32.6 | 33.0 |
| 1994 | 36.0 | 32.5 | 35.2 | 34.7 | 34.4 | 33.0 | 33.7 | 33.2 | 33.0 | 32.4 | 32.2 | 32.6 | 33.6 |
| 1995 | 32.6 | 33.6 | 34.0 | 34.9 | 32.4 | 32.8 | 32.8 | 31.5 | 31.8 | 30.6 | 32.0 | 31.8 | 32.6 |
| 1996 | 31.6 | 33.0 | 32.7 | 33.5 | 32.7 | 32.6 | 32.0 | 31.0 | 32.0 | 31.6 | 31.6 | 31.3 | 32.1 |
| 1997 | 31.3 | 32.6 | 33.8 | 33.0 | 34.1 | 31.8 | —- | 33.2 | 32.1 | 31.4 | 31.8 | 33.0 | 32.6 |
| 1998 | 31.6 | 32.1 | 34.2 | 33.7 | 34.2 | 32.1 | 32.2 | 32.7 | 30.3 | 31.4 | 32.7 | 31.5 | 32.4 |
| 1999 | 31.6 | 30.0 | 33.1 | 32.0 | 33.9 | 32.5 | 31.7 | 31.0 | 30.0 | 30.2 | 30.7 | 30.0 | 31.4 |
| 2000 | 27.0 | 30.0 | 31.6 | 34.5 | 32.4 | 32.6 | 31.4 | 33.3 | 31.0 | 32.5 | 33.2 | 33.2 | 31.9 |
| 2001 | 33.1 | 34.4 | 33.0 | 35.4 | 31.6 | 33.1 | 31.0 | 32.4 | 30.2 | 33.5 | 33.8 | 33.4 | 32.9 |
| 2002 | 33.4 | 34.4 | 34.8 | 35.5 | 34.8 | 32.5 | 33.2 | 33.1 | 32.0 | 33.0 | 33.0 | —- | 33.6 |
| 2003 | 34.2 | 34.6 | —- | 33.1 | 33.4 | 32.2 | 33.3 | 33.4 | 32.7 | 32.3 | 32.7 | 32.7 | 33.1 |
| 2004 | 33.1 | 33.0 | 37.6 | 36.2 | 34.8 | 32.7 | 32.9 | 33.7 | 32.4 | 32.4 | 33.2 | 33.1 | 33.8 |
| 2005 | 33.4 | 33.4 | 34.8 | 35.1 | 33.2 | 32.8 | 33.3 | 33.4 | 32.8 | 30.2 | 32.5 | 33.0 | 33.2 |
| 2006 | 33.2 | 33.5 | 34.5 | 35.3 | 33.7 | 32.3 | 33.0 | 32.9 | 32.8 | 33.0 | 32.3 | 33.0 | 33.3 |
| 2007 | 33.1 | 33.5 | 34.0 | 34.9 | 32.7 | 33.0 | 33.1 | 32.2 | 32.7 | 32.0 | 32.5 | 32.3 | 33.0 |
| 2008 | 32.9 | 33.1 | 33.6 | 33.8 | 33.7 | 32.2 | 31.9 | 32.5 | 31.8 | 31.7 | 32.5 | 32.5 | 32.7 |
| 2009 | 32.6 | 32.6 | 34.5 | 34.4 | 33.5 | 32.8 | 33.7 | 33.3 | 33.2 | 33.2 | 29.7 | 31.3 | 32.9 |
| 2010 | 33.2 | 34.0 | 34.5 | 35.3 | 32.8 | 33.0 | 32.0 | 31.8 | 30.5 | 31.0 | 32.1 | 32.7 |
For major cities in Guatemala, such as Guatemala City or Puerto Quetzal, the average maximum temperature during the winter is about 86 degrees Fahrenheit or 30 Celsius.
During the summer, temperatures typically increase but not by much. During this period, the average high is 90 degrees Fahrenheit or 32 Celsius and the average low is 75 degrees Fahrenheit or 24 Celsius.
Rainy and Dry Months
The table below from the Guatemala Institute of Meteorology shows the average rainfall in millimeters by month for a 20-year period. It clearly shows a dry season from December through April and a rainy season from May through November.
| JAN | FEB | MAR | APR | MAY | JUN | JUL | AUG | SEP | OCT | NOV | DEC | ANNUAL | |
|---|---|---|---|---|---|---|---|---|---|---|---|---|---|
| 1990 | 0.0 | 38.0 | 0.0 | 105.4 | 329.7 | 307.3 | 216.3 | 163.5 | 107.0 | 263.6 | 46.1 | 29.6 | 1606.5 |
| 1991 | 0.0 | 0.0 | 5.2 | 18.6 | 98.8 | 437.0 | 224.3 | 175.7 | 150.2 | 97.8 | 37.2 | 7.6 | 1252.4 |
| 1992 | 0.0 | 0.0 | 83.1 | 53.0 | 123.9 | 266.1 | 434.1 | 160.3 | 419.5 | 94.8 | 77.9 | 0.0 | 1712.7 |
| 1993 | 14.8 | 0.0 | 5.4 | 13.8 | 143.3 | 497.7 | 332.7 | 245.0 | 374.2 | 90.8 | 25.7 | 0.0 | 1743.4 |
| 1994 | 0.0 | 0.0 | 0.0 | 30.5 | 103.9 | 149.8 | 98.5 | 330.8 | 203.4 | 197.1 | 45.4 | 13.0 | 1172.4 |
| 1995 | 0.0 | 0.0 | 0.0 | 18.6 | 96.8 | 323.4 | 138.3 | 472.1 | 176.2 | 271.3 | 10.8 | 3.6 | 1511.1 |
| 1996 | 4.8 | 0.0 | 0.0 | 69.6 | 167.7 | 419.0 | —- | 366.1 | 292.9 | 167.6 | 72.8 | 0.0 | 1560.5 |
| 1997 | 0.0 | 0.0 | 14.4 | 97.2 | 9.4 | 281.0 | 285.8 | 136.8 | 636.9 | 363.2 | 185.9 | 41.2 | 2051.8 |
| 1998 | 0.0 | 0.0 | 0.0 | 0.0 | 40.0 | 263.3 | 414.4 | 323.8 | 221.5 | 446.0 | 946.0 | 0.0 | 2655.0 |
| 1999 | 0.0 | 0.0 | 14.0 | 59.4 | 108.6 | 434.9 | 396.0 | 183.8 | 517.5 | 205.6 | —- | —- | 1919.8 |
| 2000 | 0.0 | 0.0 | 32.0 | 18.7 | 353.8 | 181.3 | 119.8 | 164.5 | 276.7 | 225.9 | 73.3 | 0.0 | 1446.0 |
| 2001 | 0.0 | 0.0 | 10.5 | 1.6 | 114.8 | 190.2 | 318.5 | 56.4 | 296.9 | 89.4 | 15.7 | 0.0 | 1094.0 |
| 2002 | 0.0 | 0.0 | 0.0 | 3.1 | 268.1 | 208.7 | 170.1 | 148.0 | 237.9 | 123.1 | 8.6 | 0.0 | 1167.6 |
| 2003 | 0.0 | 0.0 | —- | 66.0 | 159.6 | 547.2 | 207.7 | 299.4 | 236.5 | 213.0 | 108.7 | 0.0 | 1838.1 |
| 2004 | 0.0 | 0.8 | 5.4 | 0.5 | 140.1 | 207.6 | 91.8 | 297.1 | 236.2 | 777.3 | 8.3 | 5.9 | 1771.0 |
| 2005 | 0.0 | 0.0 | 1.1 | 59.0 | 118.3 | 487.8 | 216.6 | 162.8 | 365.1 | 802.3 | 1.6 | 0.0 | 2214.6 |
| 2006 | 0.2 | 0.0 | 0.0 | 12.2 | 297.3 | 325.9 | 320.5 | 22.1 | 112.9 | 163.7 | 151.6 | 2.0 | 1408.4 |
| 2007 | 0.0 | 56.8 | 0.0 | 24.4 | 191.3 | 187.7 | 295.2 | 480.1 | 195.6 | 368.7 | 0.0 | 0.0 | 1799.8 |
| 2008 | 0.0 | 58.4 | 22.2 | 87.7 | 202.1 | 385.1 | 254.9 | 316.6 | 396.5 | 128.2 | 1.9 | 0.0 | 1853.6 |
| 2009 | 0.0 | 0.0 | 0.0 | 22.0 | 189.0 | 182.4 | 189.9 | 338.4 | 105.1 | 143.9 | 239.3 | 37.5 | 1447.5 |
| 2010 | 0.0 | 0.4 | 0.0 | 83.4 | 733.1 | 398.3 | 450.7 | 594.7 | 804.2 | 83.6 | 3.9 | 3152.3 |
Heavy rain may begin around the end of April and last into June or even July. The rainiest month in Guatemala, specifically for Guatemala City and Puerto Quetzal, is May.
It often rains for only a couple of hours a day, so trips may remain a possibility.
The driest months are November through February. January usually has the least rainfall—and sometimes none at all.
Coping With the Heat
Owing to its tropical nature, Guatemala is often hot and humid, especially during summer and the dry months. In fact, for those travelling from colder temperatures, e.g. Northern Europe, caution is advised if traveling at certain times of year.
While the heat may not excessively affect someone, the adverse effects may be evident on persons with heat sensitivity. Fatigue and dehydration are possible with prolonged exposure and/or physical activity for those in high risk heat disorder group. As such, caution is advised.
Highlights Of The Year
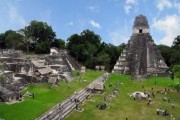
Apart from the regular holidays such as Christmas or Easter, there is one major celebration on the Guatemalan calendar, the Kite festival at Santiago Sacatepéquez.
The kite festival is a major celebration held on All Saints Day, Nov. 1. Major highlights of the event include hundreds of spectacularly designed kites made by locals. Normally, there are parades and other events on the streets as well.
Best Times to Go
While this is a rough guide, the best times to visit Puerto Quetzal are during the dry season from November through March.
December and January are great months to visit as they remain the coolest months especially in the highlands. Moreover, there are often clear blue skies and fresh sunny days.
As a matter of caution, it is important to note that Guatemala has one of the highest violent crime rates in Latin America. It is therefore important that travellers remain in groups and follow the instructions of their travel agents and excursion guides.
On an individual level, travellers should also take care in all parts of the country, including Guatemala City. Finally, avoid traveling on public buses (repainted U.S. school buses). Private intercity coach services are safer.
6 Popular Guatemala Tours
 Discover six of the best shore excursions in Guatemala for adventurous travellers.
Puerto Quetzal Excursion Tips
 Puerto Quetzal shore excursions emphasize many ways of touring the colonial city of Antigua.
Santo Tomás Cruise Port Guide
 Santo Tomás de Castilla lies snugly inside Amatique Bay on the Caribbean coast of Guatemala.