St. Thomas Monthly Weather Averages
 |
| Megans Bay beach is almost always warm. © USVI Dept. of Tourism |
The monthly weather in St. Thomas, U.S. Virgin Islands, is warm all year and has typical temperatures and rainfall for the eastern Caribbean.
Although temperatures don’t vary much, the average rainfall certainly does.
The islands are attractive because of duty-free shopping for U.S. citizens and because passports aren’t required for Americans to vacation there.
The shopping helps make the U.S. Virgin Islands a popular stopover for cruise ships. About three times as many people visit there by cruise as people who plan to stay there for a longer-term vacation.
Close to U.S.V.I. are the British Virgin Islands, which share similar weather but are known for long-term vacations more than for cruise visits.
St. Thomas Temperatures
 |
| St. Thomas monthly temperatures. © 2021 Scott S. Bateman |
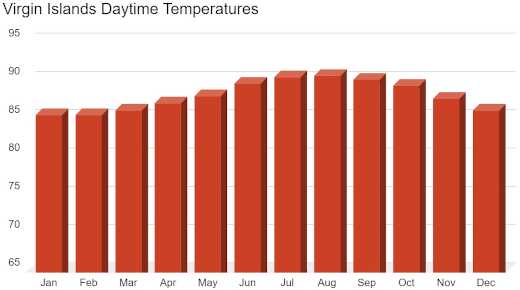
St. Thomas monthly temperatures range from a daytime high of 90 degrees Fahrenheit or 32 Celsius in summer to 85 Fahrenheit or 29 Celsius in winter.
The average monthly high temperature for the Virgin Islands is nearly 88 degrees Fahrenheit, according to the Southeast Regional Climate Center.
The average highs stay in a range between the mid 80s and 90 Fahrenheit all year long. It is one of the warmest islands in the Caribbean.
It even stays warm during the winter and early spring months of December through March. People who like hot weather will find plenty of it in the summer when the average highs exceed 90 degrees in July and August.
The average monthly low temperature is 75 degrees Fahrenheit. The low temperatures take place mostly at night.
The island’s air temperature stays warm throughout the year. But the seawater temperature will become cooler and sometimes uncomfortable during winter months when air temperatures decline somewhat.
Average Rainfall
 |
| St. Thomas average monthly rainfall. © 2023 Scott S. Bateman |
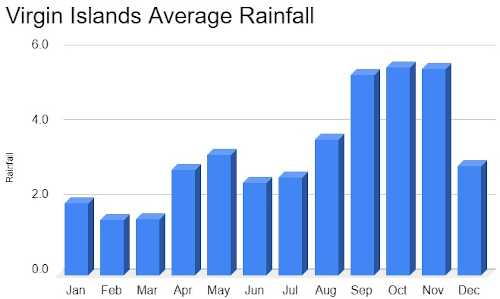
But it’s the rain that makes planning the timing of a cruise or visit a good idea. The islands receive a total of nearly 40 inches of rain during the year.
It rains less than 2 inches a month in January, February and March. It rains more than five inches each in September, October and November. Those three months are the most active months of the annual Caribbean hurricane season.
Because of winter warmth and low rainfall, December through April are the favorite months to visit the Virgin Islands, according to the Caribbean Tourism Organization. Heavy rainfall makes September the least popular month, followed by October and August.
A recent trip to St. Thomas in December found the island with warm temperatures, nearly clear skies and no rain.
Anyone planning a trip to the Virgin Islands will find the risk of bad weather at a low point from December through June, while the highest risk is during the months of late summer and early fall.
• St. Thomas weather in
January - February - March - April - May - June - July - August - September - October - November - December
St. Thomas Cruise Port Guide
 The St. Thomas cruise port is packed with attractions and popular for duty-free shopping.
Best Times to Visit U.S. Virgin Islands
 The best times to visit the U.S. Virgin Islands are December through April during the dry season.
Best St. Thomas Tourist Attractions
 Unique USVI attractions include Fort Christian, the historic Christiansted and Coral World Ocean Park.